Have you ever questioned whether your business choices are as good as they could be? Consider using a crystal ball to help you make decisions. That’s where BI and data analytics come in, transforming unstructured data into insightful knowledge that informs wise choices. These techniques turn guessing into a precise science, whether it’s identifying market trends or predicting future events. Are you prepared to see how using BI and data analytics may help your business reach new heights? Let’s explore!
Understanding Business Intelligence (BI)
Business intelligence (BI) empowers businesses to make data-driven decisions by collecting, sorting, analyzing, and presenting data in actionable formats. It transforms raw numbers into insights, enabling companies to better understand their operations and make informed choices.
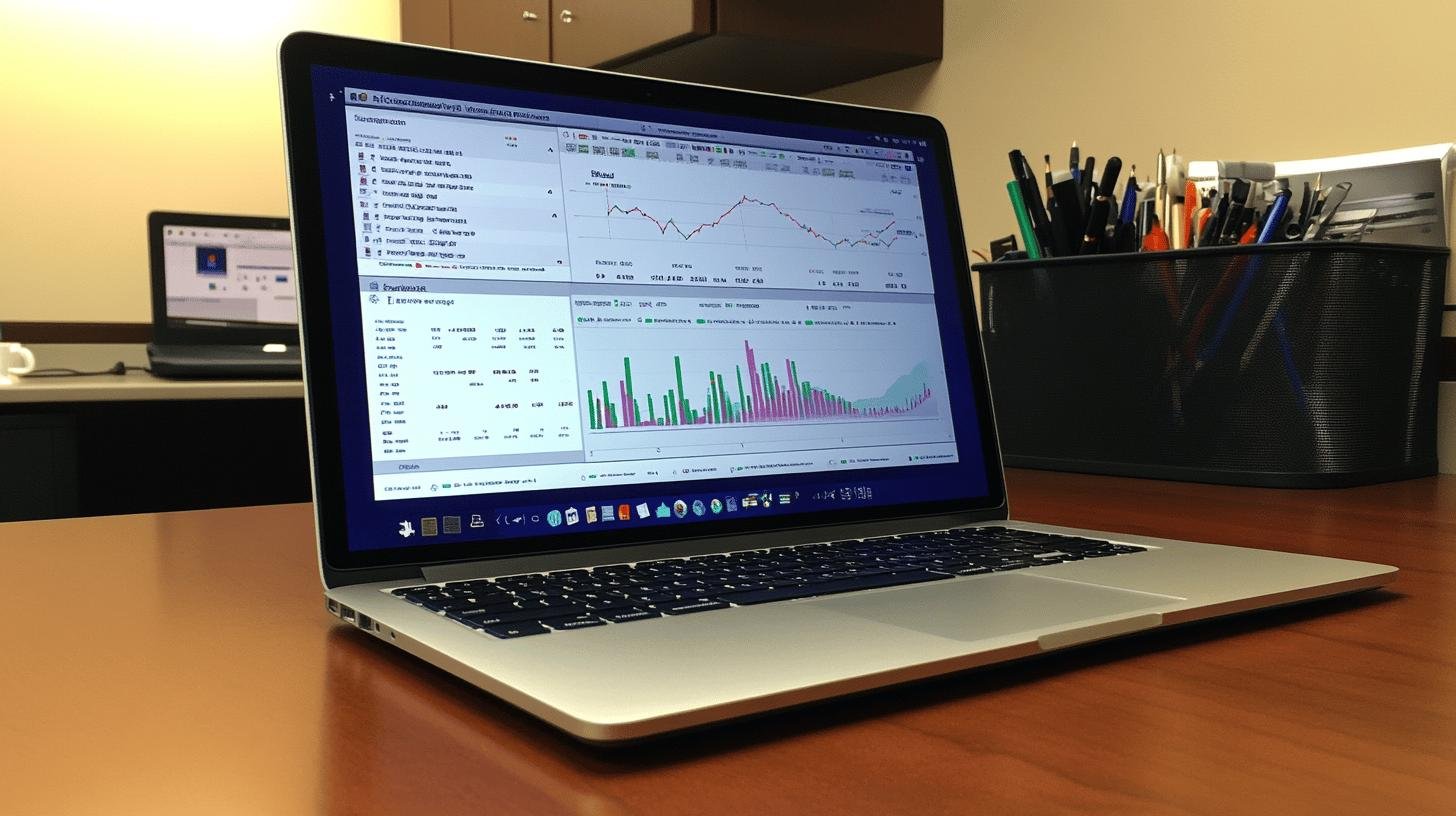
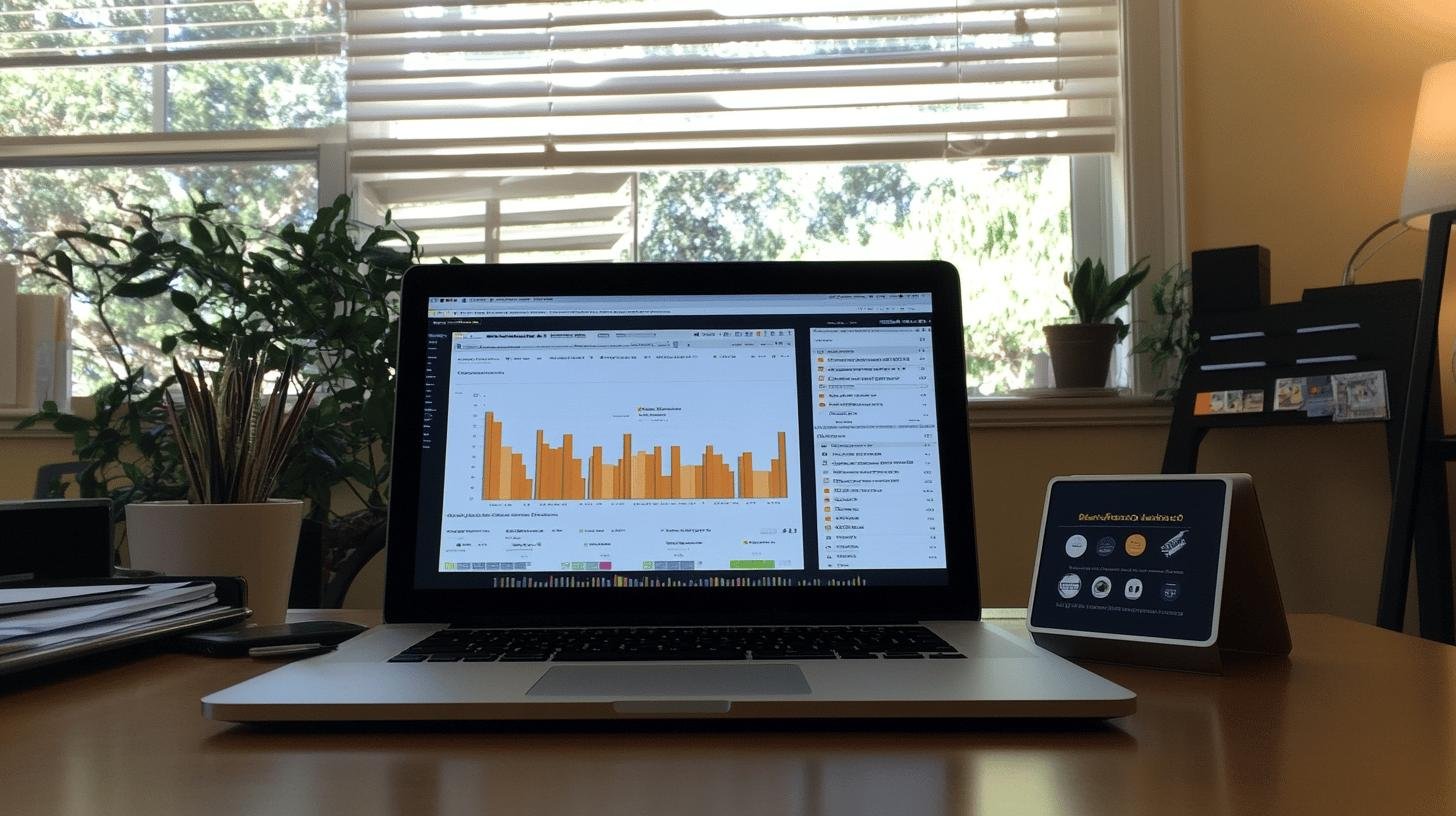
Key BI features include data mining for uncovering patterns, data visualization for creating clear charts and graphs, and predictive analysis to forecast future trends. By analyzing data from sources like supply chains, marketing, and sales, BI replaces guesswork with facts, acting like a crystal ball to guide smarter, strategic decisions.
- Data mining
- Data visualizations
- Business performance management
- Location intelligence
- Interactive reports
- Predictive analysis
Exploring Data Analytics

Data analytics is like detective work for numbers, involving processes like collecting, cleaning, transforming, and modeling data to uncover insights. It helps businesses identify trends, predict outcomes, and make data-driven decisions.
Techniques such as data wrangling, real-time analytics, and data warehousing streamline the process, while tools like Microsoft Power BI, Tableau, Sisense, and Google Looker Studio transform raw data into visually engaging dashboards and charts. These tools and methods empower businesses to analyze and act on their data effectively.
- Data wrangling
- Real-time analytics
- Data exploration
- Data warehousing
- Data modeling
Key Differences Between BI and Data Analytics
Business intelligence (BI) focuses on analyzing past data to inform future decisions, helping businesses understand historical trends and patterns through reports and dashboards. BI tools collect and analyze data from various sources, providing insights that guide data-driven decision-making.
Data analytics, in contrast, uses statistical methods to uncover deeper insights from raw data, aiming to identify hidden patterns, predict future trends, and solve complex problems. While BI offers a broad view of past performance, data analytics dives deeper into specific data points, complementing BI to provide a comprehensive approach to leveraging data for better business decisions.
| Aspect | Business Intelligence | Data Analytics |
|---|
| Primary Focus | Past data | Statistical analysis |
| Main Objective | Inform future decisions | Uncover deeper insights |
| Tool Usage | Dashboards and reports | Actionable insights |
Popular Tools for BI and Data Analytics

Choosing the right tools for BI and data analytics can greatly impact how effectively a business gathers insights and makes decisions. These tools help organize and visualize data, making it easier to understand and act upon. Let’s explore some popular options.
1. Popular BI Tools
Tableau and Microsoft Power BI are popular business intelligence tools. Tableau excels at creating interactive and visually appealing data visualizations, offering easy integration with various data sources. Microsoft Power BI is valued for its user-friendliness and seamless integration with Microsoft products like Excel and Azure, making it ideal for businesses already using Microsoft services.
2. Popular Data Analytics Tools
Sisense and Google Looker Studio are leading tools in data analytics. Sisense stands out for its powerful data visualization and ability to manage large datasets, integrating well with various platforms. Google Looker Studio excels in visualizing and integrating data, particularly for businesses using multiple sources, and its seamless integration with other Google services makes it ideal for those within the Google ecosystem.
Benefits of BI and Data Analytics for Businesses
Business intelligence (BI) and data analytics are crucial for optimizing operations by collecting and analyzing data from various sources. These tools help businesses streamline processes, reduce costs, and increase productivity, offering a clear view of inefficiencies and areas for improvement. Data-driven decision-making acts like a GPS, minimizing errors and improving efficiency by providing factual insights, such as helping retailers track product sales to optimize stock levels and reduce waste.
BI and data analytics are applied in innovative ways across industries. Predictive analysis uses machine learning to forecast future trends, allowing companies to prepare for what’s ahead. In call centers, BI tools analyze customer interactions to identify successful phrases, helping businesses enhance service quality and customer satisfaction.
- Optimize operations
- Reduce mistakes
- Improve efficiency
- Forecast future events
- Enhance customer interactions
Career Paths in BI and Data Analytics

A BI professional acts as a data wizard, creating dashboards and visualizations to help businesses understand their data. They track metrics like sales performance and supply chain efficiency, providing decision-makers with clear, actionable insights. Their work ensures businesses can make informed choices by presenting data in an easily digestible format.
Data analysts, on the other hand, focus on uncovering deeper patterns and trends in data. Using statistical methods and tools like Excel or SQL, they clean, analyze, and transform raw data into meaningful insights. A bachelor’s degree in business, finance, or IT is typically required for both roles, with advanced positions often preferring a master’s degree. Certifications in BI or data analytics tools can further boost career prospects in this competitive field.
- BI Analyst
- Data Scientist
- Data Engineer
- Business Analyst
- Data Visualization Specialist
Conclusion
We explored BI and data analytics, examining their definitions, core features, and key differences. BI tools like Tableau and Power BI make data presentation easier, while analytics tools such as Sisense and Looker Studio provide deeper insights.
By understanding these tools, businesses can enhance data-driven decision-making, optimize operations, and improve efficiency. Both BI and data analytics offer exciting career opportunities and valuable benefits, empowering smarter, more informed choices. Dive into the world of business and data analytics today!
FAQ
What is BI and data analytics?
Business intelligence (BI) involves using data to make informed business decisions, while data analytics involves analyzing data sets using statistical methods to gain insights.
Is BI the same as a data analyst?
No, BI includes data analytics as a component but aims to assist users in drawing conclusions from data analysis. Data analysts focus on transforming data into actionable insights.
Who earns more, a BI analyst or a data analyst?
Generally, BI analysts tend to earn slightly more than data analysts due to the strategic nature of their roles. However, salaries can vary based on location, experience, and industry.
What does a BI-analyst do?
A BI analyst collects, sorts, analyzes, and presents business data to help make informed decisions. They create dashboards, generate reports, and conduct predictive analysis.


